Concept 2026 · Real estate
Westbridge Capital
A map-led investment site that lets investors see every building.
Story Case study
Overview
Westbridge Capital is a concept real estate investment firm that acquires, develops and manages residential and commercial property across the New York tri-state area, for family offices and accredited investors. I designed and built the real estate investment website around one idea: investors should be able to see the buildings, not just read about them.
The challenge
Investment firm websites tend to be walls of text and stock skylines. For a private capital audience, the real questions are concrete: what do you own, where, under which strategy, and how do you report? The brief was to answer those questions visually and give serious investors a clear next step, without making the site feel like a dashboard.
What I built
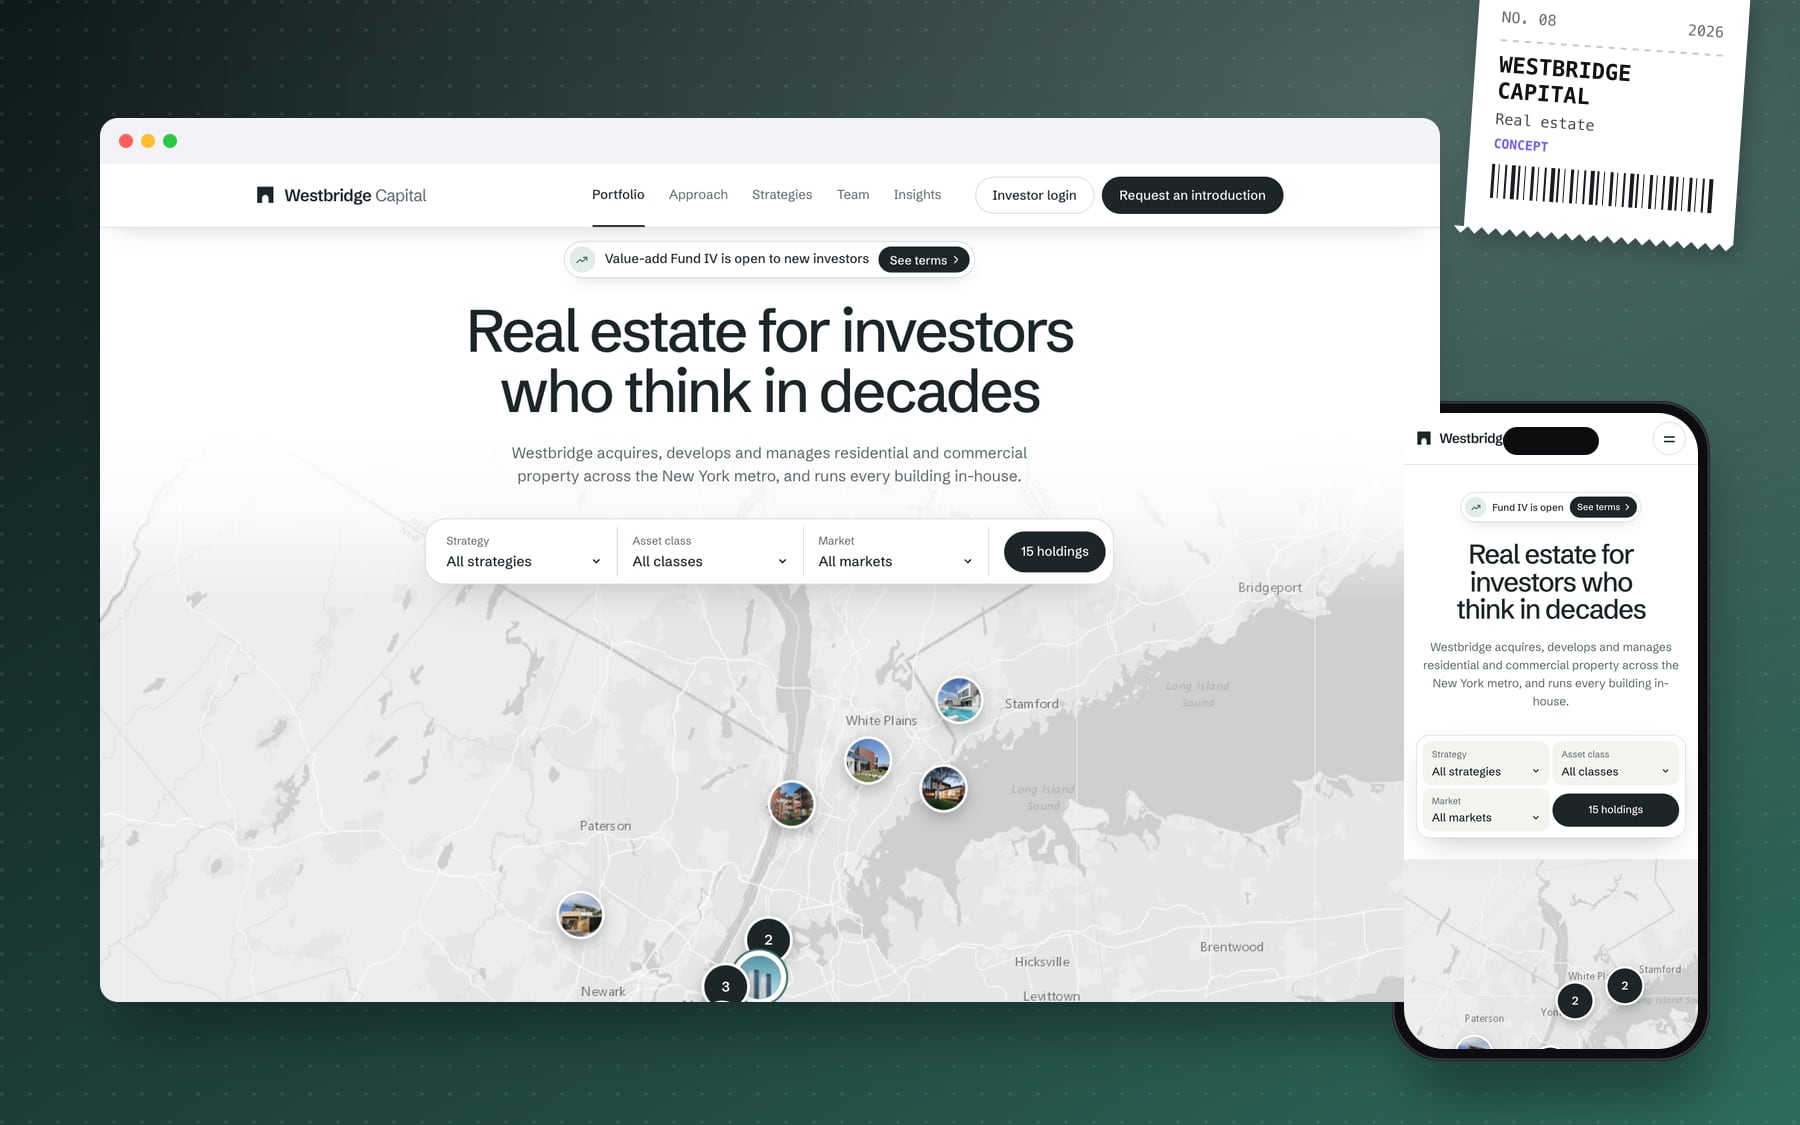
- A map hero: a Leaflet map of the holdings with photo pins, cluster count bubbles and a filter bar for strategy, asset class and market. Pins open a custom floating card with a "Request memo" action.
- A map language for every section: a 45-minute radius minimap around the office, a case study drawn as a dashed route over a street map, and a contact card floating over the office location.
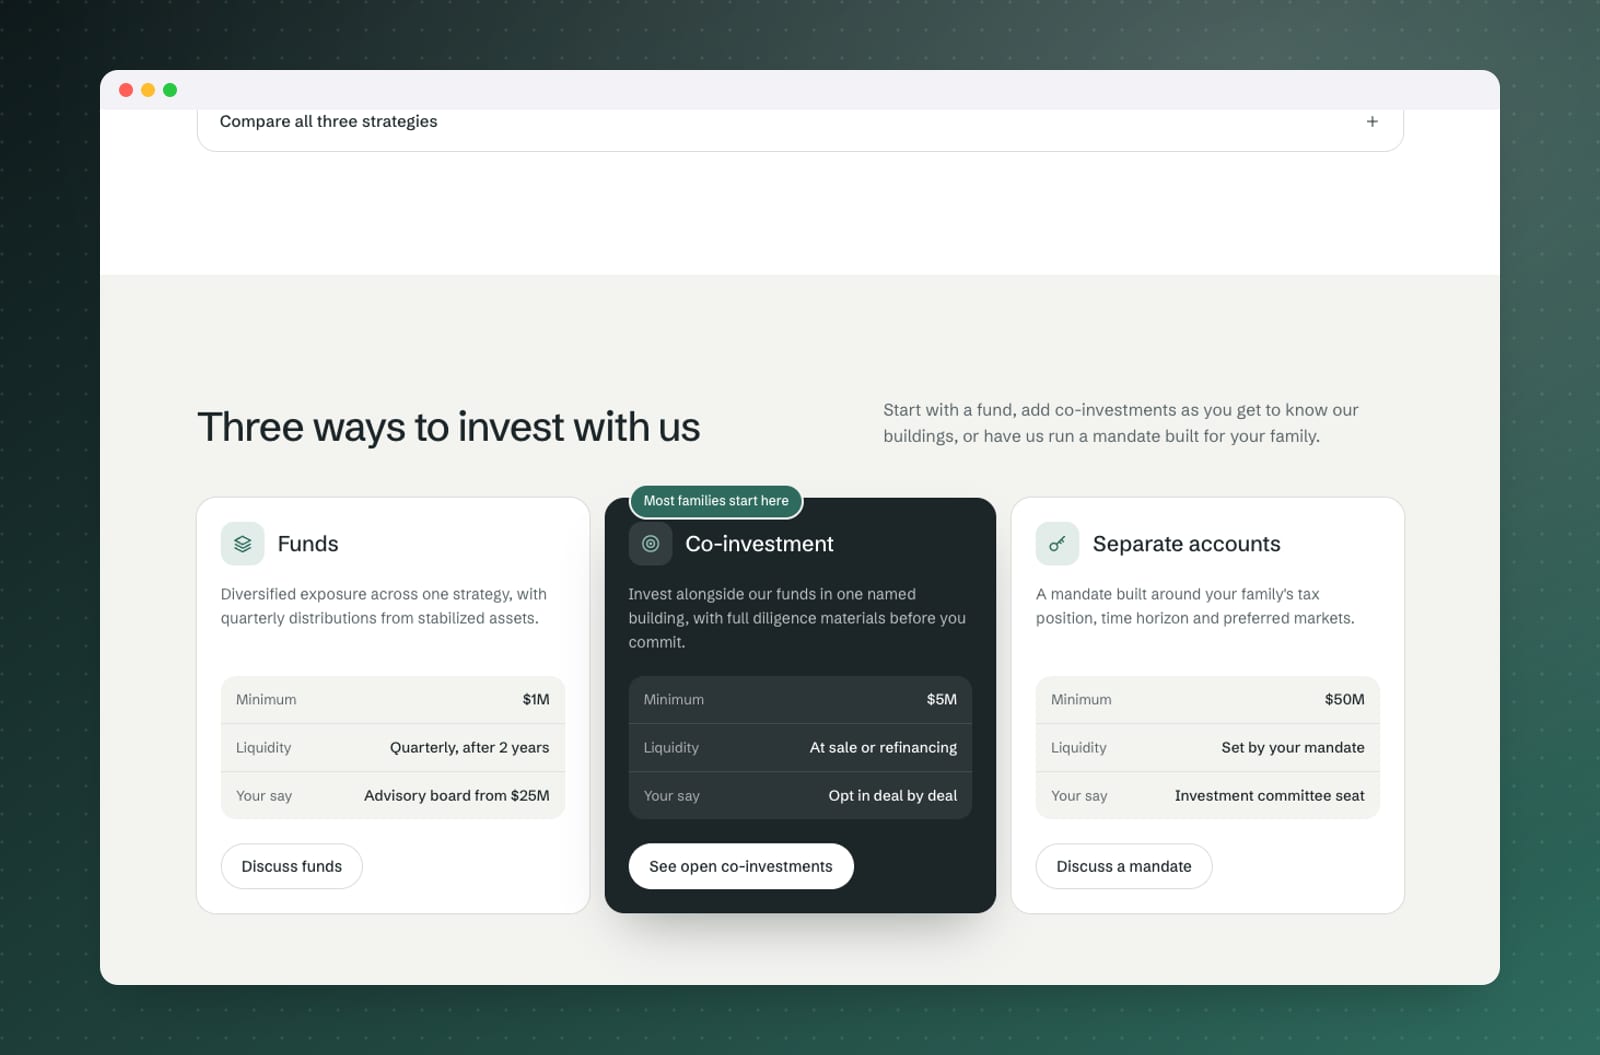
- Strategy tabs for core-plus, value-add and development that drive a clustered map, with a "Show on the map" link that sets the hero filter.
- A case-study timeline following one building from acquisition to realisation.
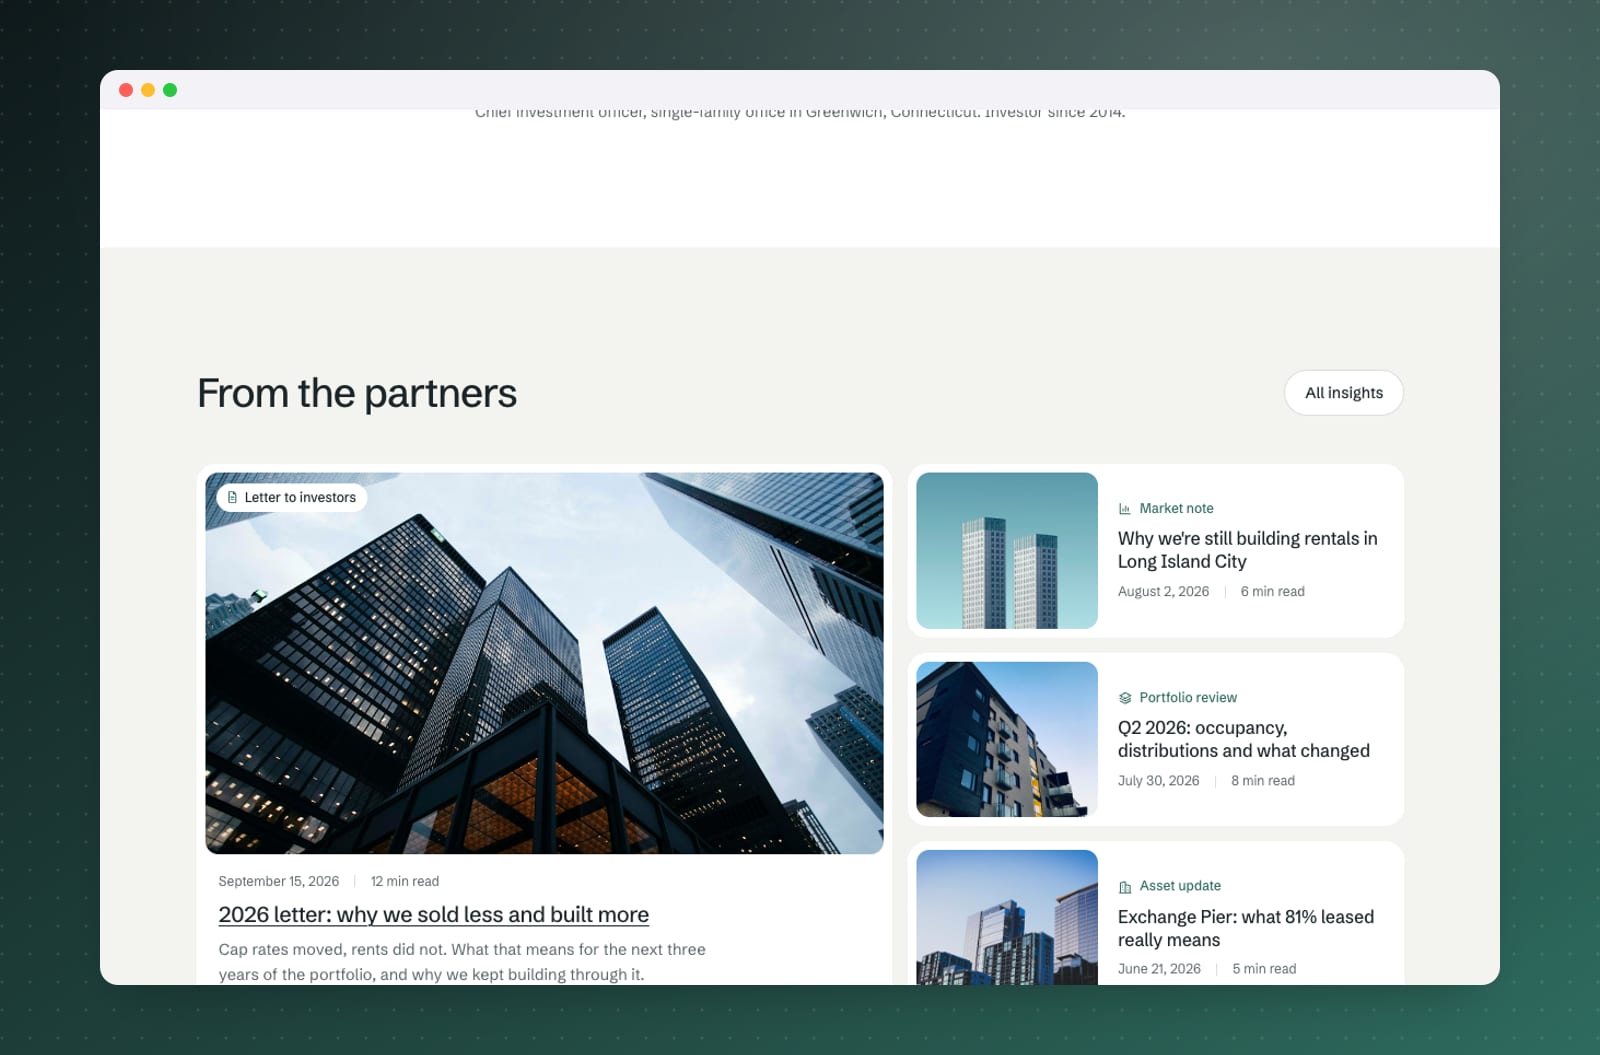
- An investor portal mock showing capital accounts, distributions and building progress.
- A question-index FAQ with an answer card per question, which becomes an accordion on mobile.
Design & build
The palette is limestone, slate and a patina green, set entirely in Schibsted Grotesk. The site is static HTML, CSS and JavaScript with Leaflet, Leaflet.markercluster and Esri light-grey tiles. I built the floating card myself instead of using Leaflet popups so pins never slide under the headline. Scroll effects include staggered reveals, a route path that draws itself and figures that count up only when seen. SEO covers structured data for Organization, FinancialService and FAQPage, plus Open Graph images and a sitemap.
What it delivers
The concept gives investors an honest way to explore a portfolio, holding by holding, and ends every path at a conversation with the partners. It shows how I approach landing pages for high-trust services. All figures, people and holdings on the site are fictional.